3 Jul 2026
Return-to-Player Disparities Across Game Types in Online Casinos

Established digital casinos maintain detailed records of return-to-player percentages that shift noticeably depending on the game category selected by participants, and these patterns emerge consistently across major platforms operating in regulated markets worldwide. Research from academic institutions highlights how slots typically feature lower average RTP values compared to table games, while live dealer options introduce additional layers of variation based on rulesets and operational structures. Data compiled through 2026 shows these differences persist even as platforms update their libraries in July of that year, reflecting ongoing adjustments in game portfolios rather than sudden regulatory shifts.
Core Principles Behind RTP Calculations
Return-to-player figures represent the theoretical percentage of wagered amounts returned to players over extended play periods, and experts calculate these values using complex mathematical models that account for random number generators and payout structures. Observers note that while all legitimate operators publish these metrics, the actual distribution varies because each category incorporates distinct probability mechanics, from reel-based symbol combinations in slots to card-drawing sequences in blackjack. Studies conducted by university research teams demonstrate that RTP transparency helps players understand long-term expectations, yet short-term outcomes remain governed by chance regardless of the displayed percentage.
Slot Games and Their Variable RTP Ranges
Slot titles in established casinos often display RTP values between 94 and 98 percent, though certain progressive jackpot games dip lower to fund larger prize pools. Those who've analyzed thousands of titles across multiple jurisdictions find that classic three-reel formats tend toward the higher end of this spectrum, whereas video slots with numerous bonus features cluster around mid-range percentages. Evidence from industry reports indicates providers adjust these figures during development cycles, and updates rolled out around mid-2026 introduced fresh volatility options without altering the underlying category averages significantly. Players frequently encounter themed releases where RTP remains fixed once certified, allowing consistent comparison across different software suppliers.
Table Games Deliver Higher Baseline Returns
Traditional table games such as blackjack, roulette, and baccarat present RTP percentages that commonly exceed 98 percent when optimal strategies apply, creating a measurable contrast with slot offerings. Researchers discovered that blackjack variants incorporating specific rules like dealer stands on soft 17 achieve figures near 99.5 percent under perfect play conditions, while roulette wheels maintain steady 97.3 percent on European layouts versus slightly reduced American versions. These consistent benchmarks arise because table game mathematics rely on fixed probabilities rather than layered bonus mechanics, and observers note how this stability attracts participants seeking predictable long-term structures within digital environments.
Live Dealer and Specialty Categories Add Complexity
Live dealer games blend physical randomness with streaming technology, resulting in RTP values that mirror their table counterparts yet incorporate minor operational adjustments for dealer pace and multiple participant interactions. Data from oversight bodies in various regions shows specialty games like keno or scratch cards occupy lower RTP territory, often between 90 and 95 percent, due to their rapid resolution cycles and prize distribution models. One analysis covering platforms active through July 2026 revealed that hybrid formats, including game shows and instant-win options, occupy an intermediate zone where RTP reflects both entertainment value and payout frequency.
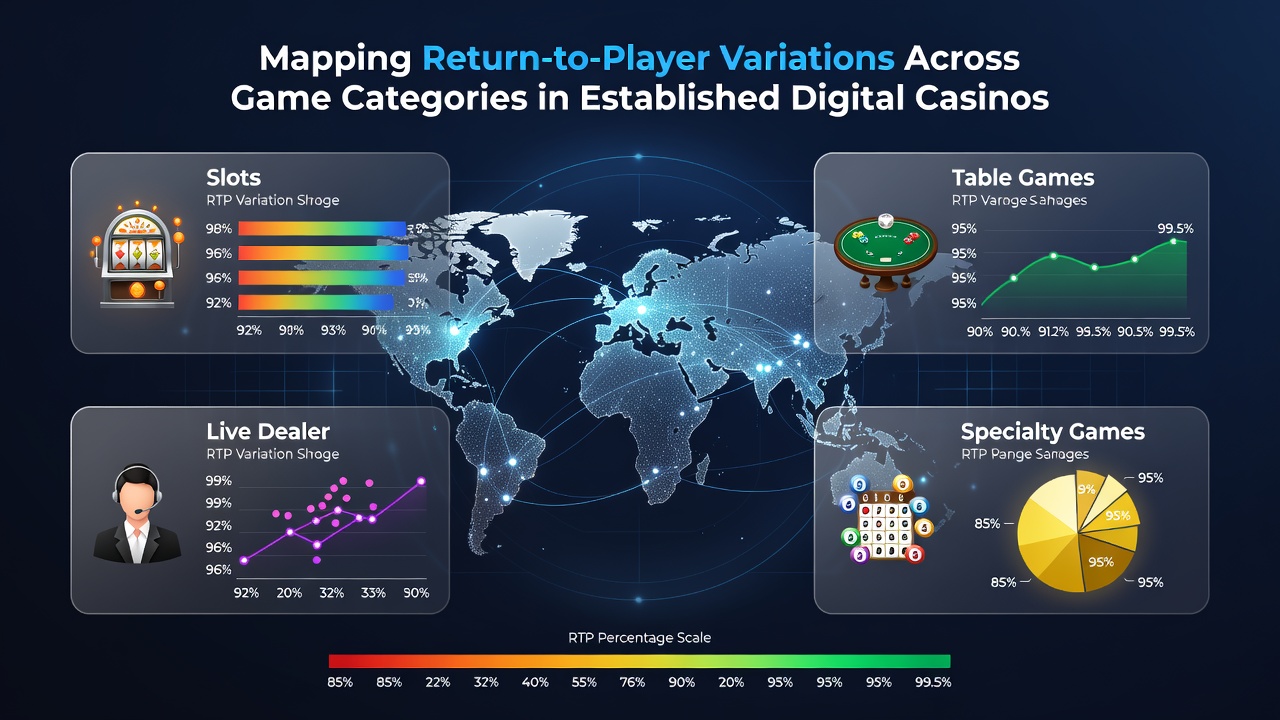
What's interesting is how regional licensing influences these distributions, since operators must align with standards set by different authorities such as those in Nevada or Australian states. According to Nevada Gaming Control Board records, table game RTPs stay tightly clustered because of strict testing protocols, whereas slot variations allow greater flexibility within approved boundaries. Similar patterns appear in reports from other markets, where certification labs verify each title before release.
Comparative Insights Across Platforms
Those examining aggregated statistics from multiple established casinos observe that game category exerts stronger influence on RTP than individual operator branding, although promotional overlays like cashback occasionally modify effective returns. Figures reveal slots account for the widest spread within any single category, driven by differing feature densities and jackpot contributions. In contrast, card-based games maintain narrower bands because their core rules limit deviation. Research indicates players who track these mappings across sessions gain clearer perspectives on expected value, even though actual results fluctuate around the published averages.
Conclusion
Mapping return-to-player variations across game categories provides a factual framework for understanding digital casino offerings, and the distinctions between slots, table games, and specialty formats remain evident in data gathered through 2026. Regulatory sources beyond single jurisdictions, including academic reviews and multi-state analyses, confirm these patterns hold across established platforms. Individuals reviewing such information encounter consistent category-level differences that arise directly from each game's mathematical foundation rather than external variables.